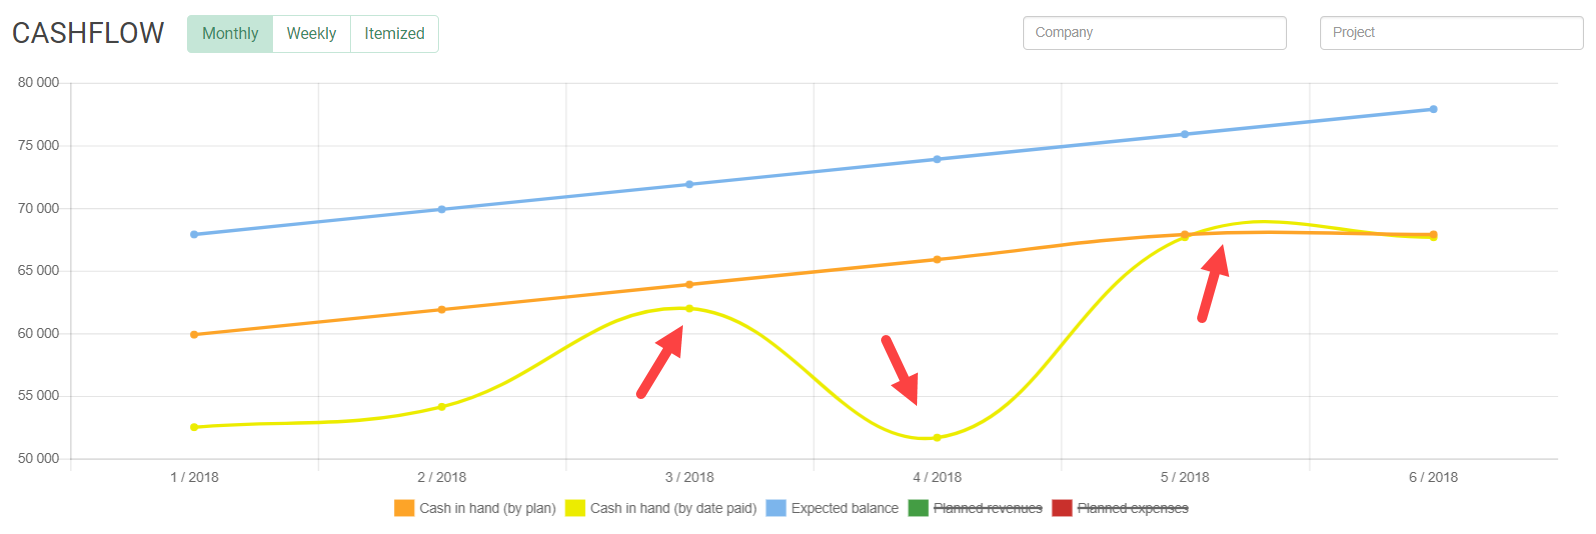
We have another cash flow upgrade for you to easily compare the plan with reality. In the graph, you see the planned cash flow (orange line) and the real cash flow (yellow line), based on actual payment date and the amount of the payment:
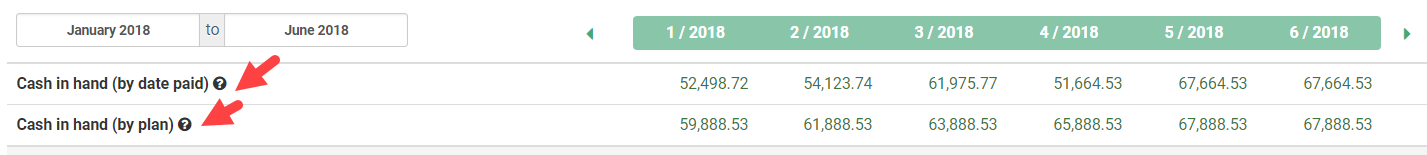
You can also easily see the exact values in the table, plan vs. reality:
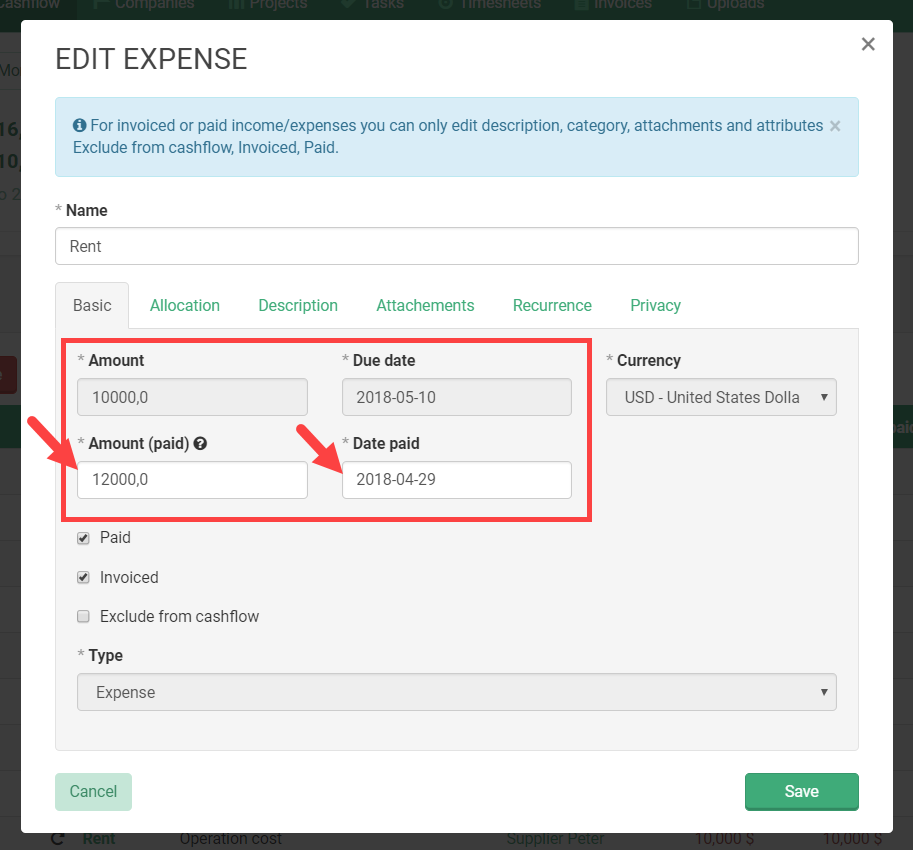
You can take advantage of the new options to compare the plan and reality by using two new attributes "Amount (paid)" and "Date paid", these you can manually adjust in the Income or Expense form. Attributes "Amount" and "Due date" are the plan, attributes "Amount (paid)" and "Date paid" represent the reality: