Managing projects, timelines, and resources isn’t easy, especially as you scale your operations. Some projects inevitably get delayed, budgets go over, and resources are poorly allocated – we’ve all been there.
If you’re regularly managing projects, you’ll know how important it is to manage your resources – both human and non-people ones. But allocating resources, assigning responsibilities, and tracking progress require visibility, structure, and careful planning. And that’s why many project managers turn to a Gantt chart.
🎓 CAFLOU® academy is brought to you by CAFLOU® - 100% digital project and business management software
What is a Gantt chart?
A Gantt chart gives you a visual view of work to be done in the form of a timeline. It includes tasks, project timelines, resources, team members, and task dependencies.
Gantt charts are popular in project management because they help you track progress and make sure you're on track for deadlines. They also help project managers identify bottlenecks, estimate a project's resource requirements, and plan budgets and schedules.
Ultimately, the purpose of a Gantt chart is to give project managers a complete visual overview of the projects they’re overseeing – and the current state of each project.
What are the different elements of a Gantt chart?
A Gantt chart in project management has different elements to help you visualise your workflows and timelines. Depending on the Gantt chart software you use, it will have some combination – or all – of these elements:
- Dates. You can view project timelines, including their start and end dates, and even see when specific tasks are scheduled to begin.
- Tasks and subtasks. Your larger projects won’t just have tasks, but eventually sub-tasks or to dos as well. Gantt charts help you track each task to help your team stay on the same page.
- Human resources. Some Gantt chart software may lack this feature, but the idea behind it is to help you outline and track each team member’s name and corresponding responsibilities.
- Bars. Bars help you keep track of subtasks by displaying the timeframe that they’re meant to be completed in.
- Milestones. Milestones are specific significant events in the project, when completed, show you’ve reached an important stage on the project.
- Task dependencies (and their different types). Some tasks can only be started after other tasks are completed or after work on them started, and you can define such relationships between tasks using dependencies.
- Visual indicators (taskbars, line markers, arrows). Gantt charts may use different indicators to visually represent progress or relationships – arrows show which tasks are dependent on each other, taskbars display the duration or progress on tasks, or a vertical line marker will indicate the current date on your chart.
How are Gantt charts used in project management?
Here are some ways that project managers use Gantt charts to organize workflows and help their teams work more effectively.
1. Manage project resources
Project resource management might be one of the less obvious uses for a Gantt chart, but it’s definitely effective. When you organize your project timelines with Gantt charts, you have insights into:
- Which team members are working on which tasks.
- The number of tasks assigned to each team member.
- The timelines for each task as well as task dependencies.
When you have access to these insights visually for each project, it makes it easy to quickly balance workloads and manage your resources. To understand this point a bit more, let’s consider an example:
You, a project manager, notice that a task on your Gantt chart, with multiple subtasks, is progressing too slowly. You decide to assign another team member to help with the subtasks, but which one? By referring to your project management software, you quickly identify a team member with the least workload who can step in.
So, just like in this example, the 360-degree project view that you get from a Gantt chart is invaluable for managing resources.
2. Track progress and milestones
If you’re overseeing multiple projects, you might not have time to dissect granular data for each project every week – you can’t always keep tabs on what each team member is working on, which tasks are in progress, etc. So Gantt charts help you keep track of what’s most important – progress.
You can set key milestones for each project, which correspond to real progress, and track them routinely. For example, your milestones could be:
- Meeting a given revenue target.
- Completing a certain percentage of the project’s tasks.
- Finishing some of the most important tasks.
By tracking milestones, you can make sure that projects are moving along in the right direction, even when you’re too busy to evaluate the specifics.
3. Manage timelines and engage stakeholders
Depending on the nature of a project, you won’t necessarily need to involve all stakeholders throughout the project’s timeline. Different team members might need to step in at different stages – and a Gantt chart helps you manage this lifecycle.
For example, you can:
- Engage different team members depending on the timeline. Do you need to involve certain employees after, say, the three-week mark?
- Assign responsibilities as milestones are reached. When one team meets certain milestones, is it time for another one to take over?
How to create Gantt charts with project management software
Project management software lets you create and manage your Gantt charts in one place along with other project management activities. You can track project timelines, assign responsibilities, and update your charts with real-time data.
And here’s more on how to start using Gantt chart software.
1. Work out which tasks need to be completed
The first step is to identify the work to be done throughout the project life cycle. You’ll want to start by defining the project’s goals – what outcomes should be achieved? Next, you and your team will need to break the project down into tasks, subtasks, and milestones.
You’ll need answers to the following:
- What tasks need to be completed to achieve the project’s goals?
- Which tasks are dependent on each other? And what type of task dependencies exist?
- How will you track and measure success? Which milestones show real progress?
2. Identify resource requirements
Now that you’ve outlined the project’s tasks and subtasks, you need to identify what resources you’ll need to complete them. This means not only identifying team members with the right skill sets, but also whether you’ll need to hire external contractors to help out.
For example, if you’re managing a marketing project, some teams outsource work to freelancers. This might include graphic design, copywriting, SEO strategy, PPC, and more. So if you’re planning to engage external resources, you need to identify the kind of resources you need and how they fit into the project’s scope.
3. Define start and end dates, and establish a project timeline
This part might seem straightforward – and in many ways – it is. But when you’re mapping out a project’s timeline, you need to consider:
1. When the project can practically start. Sometimes, you won’t have everything you need to start the project immediately. For example, if you need to fulfill some resource requirements before the project can begin, you need to factor in the bottleneck.
2. How long the project should take to complete. Your team members should weigh in on how long each task should take to complete, and you can use these estimations to help approximate the project timeline.
3. Important milestones. Which progress indicators should you track? And at what stages should you review the project’s progress?
According to Wellingtone’s State of Project Management report, 50% of organizations “mostly or always” establish a baseline for their project schedules. But to establish this baseline, you’ll need to consult historical data from previous projects and collect insights from your team members.
4. Create your Gantt chart using the tasks
Now that you have all the information you need, it’s time to create your Gantt chart. You can start by creating a new project, inputting its start and end dates, and continuing to add each task. Most project management tools let you add specific details about each task, too, such as its estimated start and end dates, descriptions, budgets, and dependencies.
5. Assign responsibilities
If you’ve completed step 2) and identified the resources you need, you can now assign responsibilities in your project management software to help with tracking and visibility. Just pick a task and assign it to the relevant team member.
6. Track progress by milestones
Tracking progress is a big part of making sure your project goals are being met. Set key milestones for each project, and when your team achieves a milestone, you can review your project timeline to make sure everything is on track.
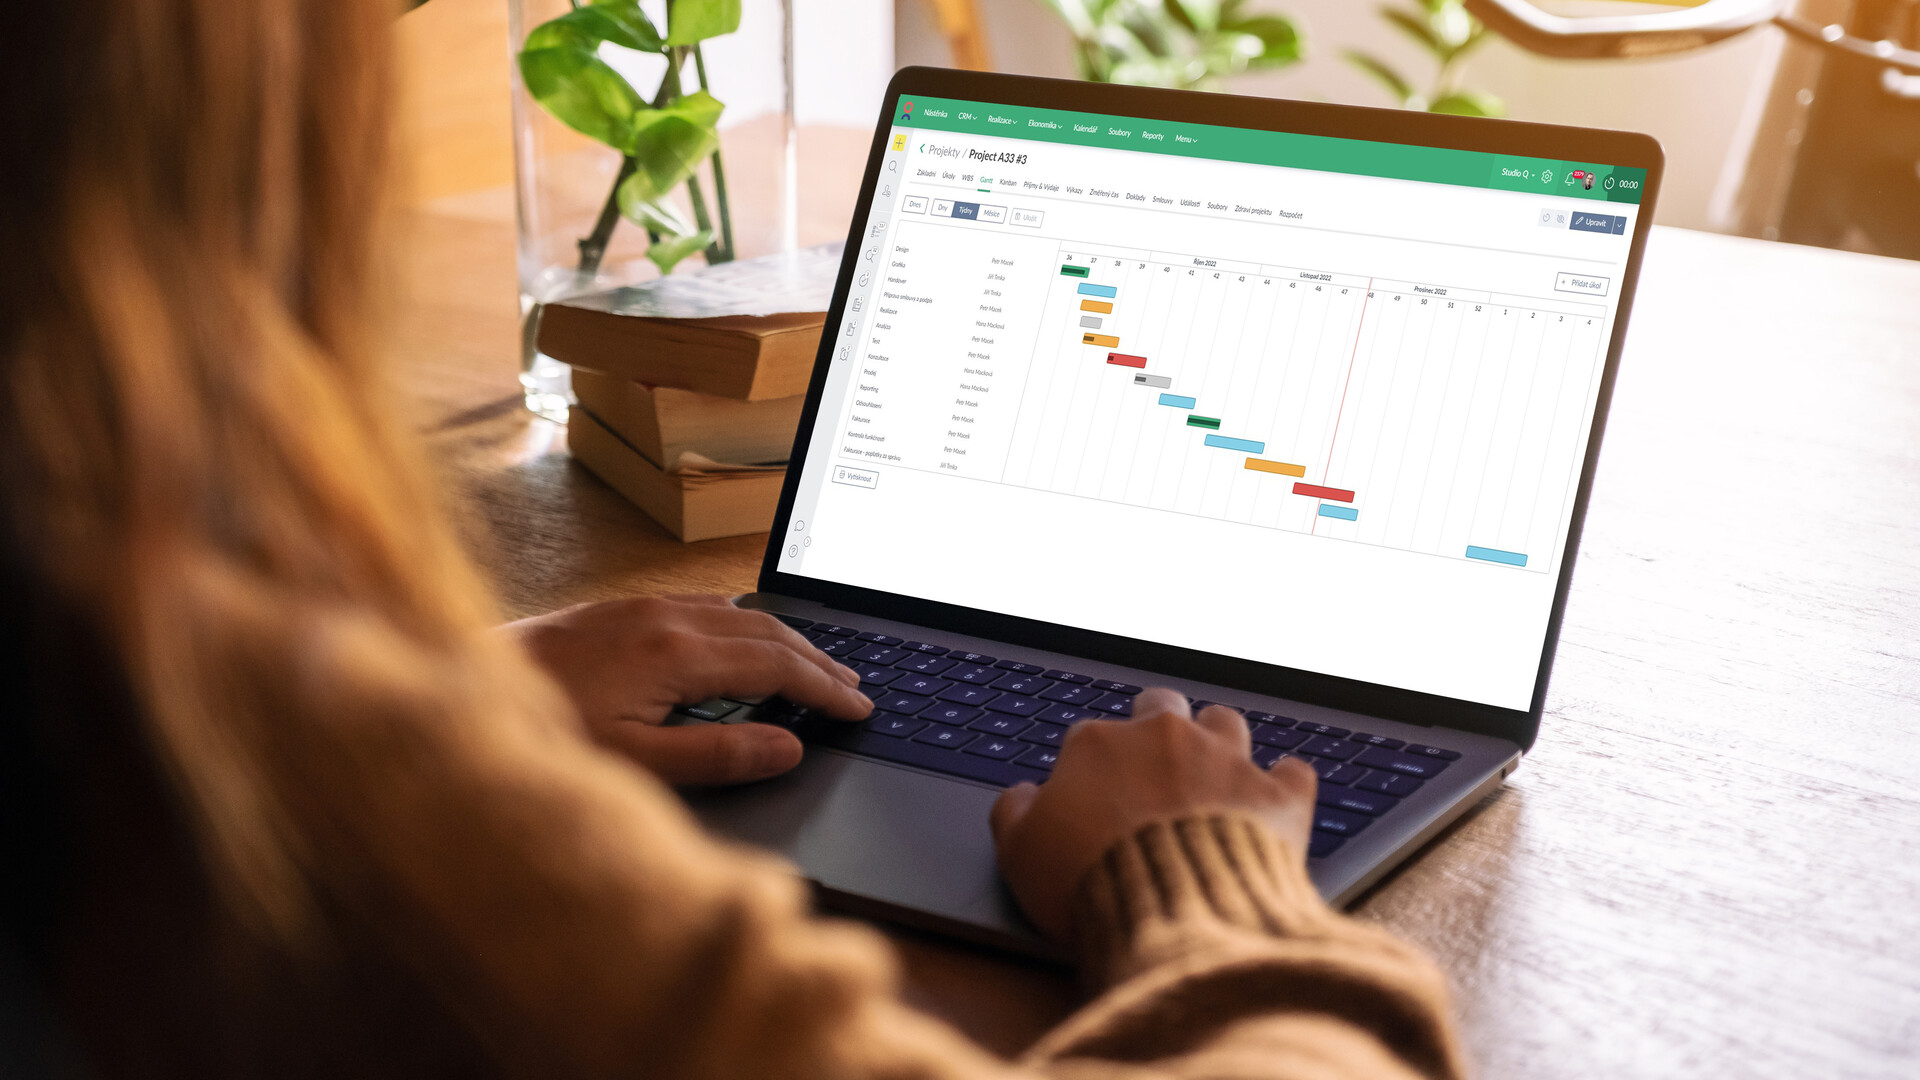
The Gantt chart should give project managers complete visibility into the project’s lifecycle, and here’s how that works with Caflou’s project management software:
How to work with a Gantt chart
Why choose Caflou for creating Gantt charts and managing projects?
Is Caflou the right choice for your business? Here’s how the business management solution helps you manage your projects through Gantt charts, and more.
1. Manage all your projects in one place
Caflou’s project management functionality lets you centralize all your projects in one place. See which projects are on track, which ones are suffering from bottlenecks, what resources are needed, and which team members are assigned to each project.
2. Get a 360-view of your business and customers
Caflou is more than a project management software – it’s a complete business management solution. With a built-in CRM, project management functionality, time management and business economics features, and workflow automation, Caflou is an all-in-one solution for managing your business.
3. Track budgets, cash flow, and business economics
Across all organizations, 11.4% of resources are wasted because of poor project management processes. And to overcome this waste, you need to have complete visibility into your business economics – even at the project level.
With Caflou, you’ll know which projects are consuming most of your resources, which are generating the most revenue, and where your greatest expenditure is. Caflou gives you complete visibility into your business economics so you can eliminate waste, identify unprofitable projects or accounts, and plan finances based on real-time data.
Manage your business from anywhere, in one place, with Caflou. Get started for free.
<< Back to all articles in the series Caflou Project Management Academy