For graphical reports we have two significant enhancements:
- Custom attributes can now be used in graphs. Meaningful attribute types such as number, list or date are allowed for charts.
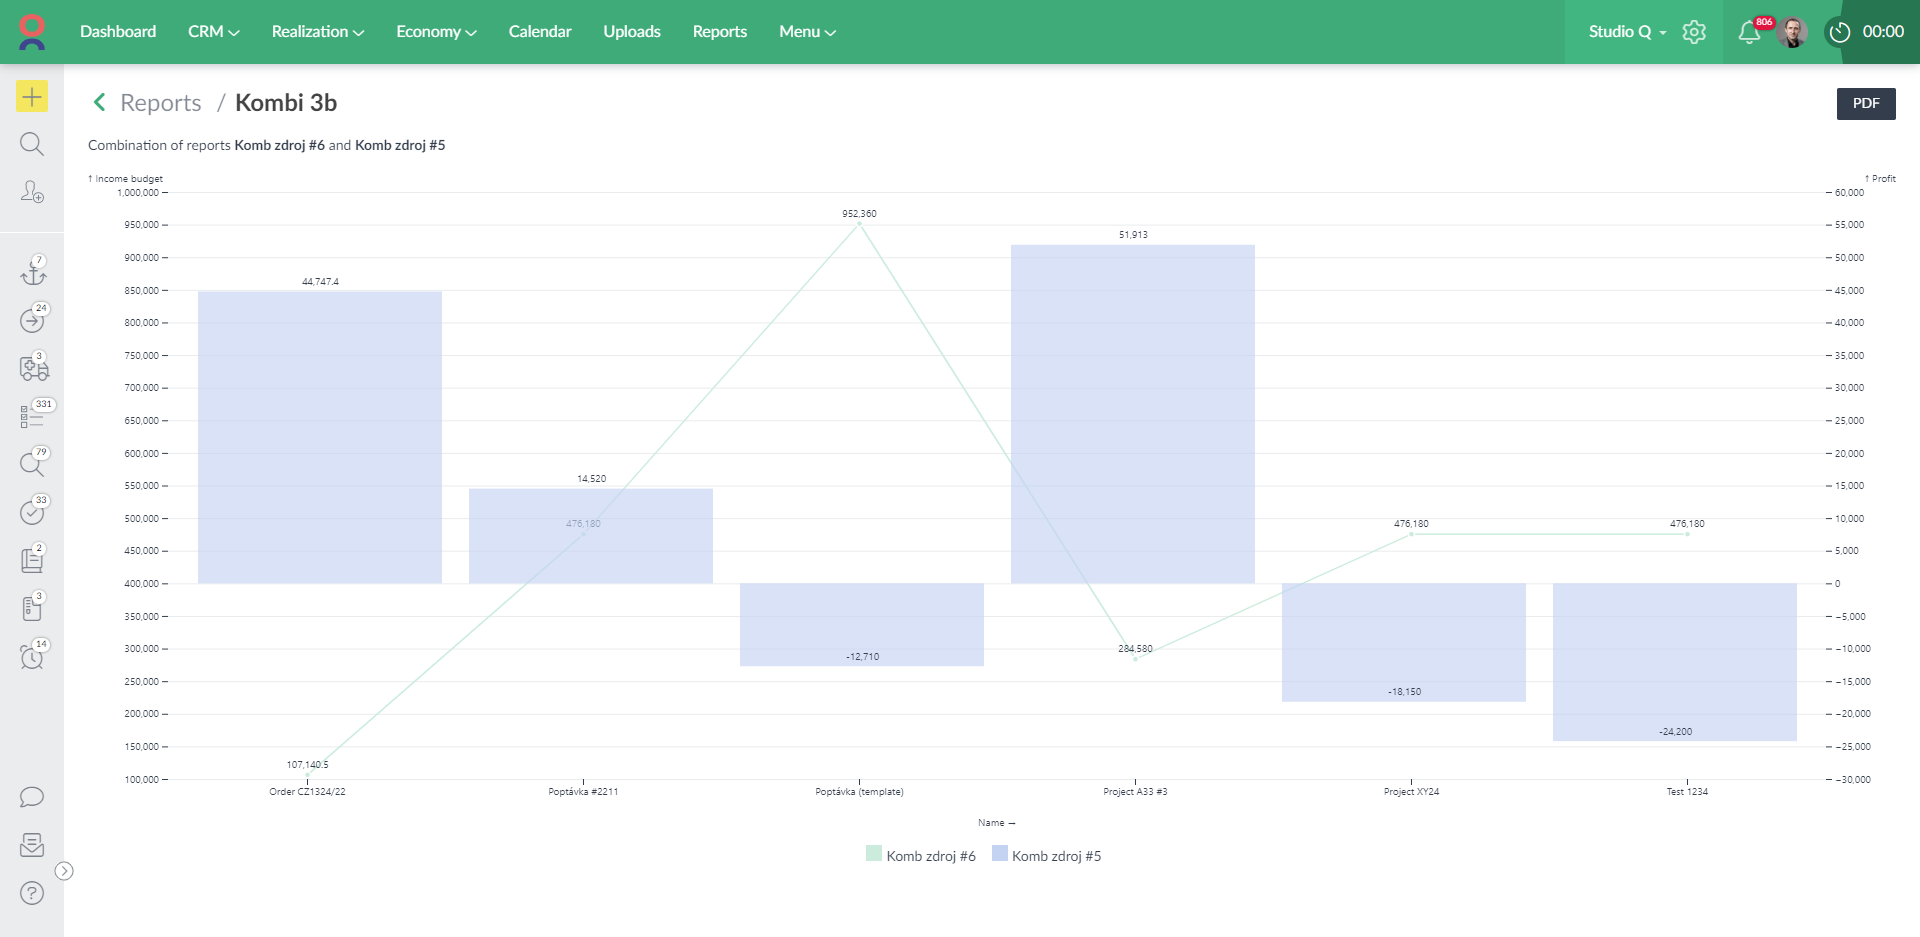
- It is possible to create a combined report that combines two separate charts into one - so you can e.g. combine charts that have a different Y-axis (e.g. you can compare project budget vs project profit etc.)
💡 Learn more about the new graphical reporting options here: How to work with custom graphical reports 📺
Learn more about custom attributes here: How to work with custom attributes 📖
We hope you will like the news and it will help you work a little more efficiently.